
Think of a BGC (Background Check) report as a detailed roadmap for your business strategy, offering a much deeper view than just surface-level data. This isn’t just a document; it’s a narrative that reveals market direction, shifts in consumer behaviour, and untapped opportunities for growth. For any business operating in India, understanding the insights packed into a BGC report is fundamental to making smart, informed decisions.
Table of Contents
What BGC Reports Reveal About the Market
A BGC report is essentially a comprehensive health check on an economy or a specific industry. It’s not a dry collection of numbers but a strategic tool that turns complex data into actionable intelligence.
Imagine trying to navigate a new city without a map. Sure, you might find your way eventually, but the process would be inefficient, frustrating, and full of risks. A BGC report is that map, guiding your business strategy with much-needed clarity.
These reports are designed to demystify the market, breaking down broad economic forecasts into segments you can actually understand and use. This allows any organisation, from a nimble startup to an established enterprise, to see the bigger picture and anticipate market shifts rather than just reacting to them.
Core Components and Their Value
At its heart, a BGC report pulls together data from multiple sources to paint a complete picture of the landscape. The information is usually organised into a few key areas that, when combined, give you a holistic view.
Here’s a quick overview of the key sections you’ll find in a BGC analysis and their strategic value.
Core Components of a BGC Report
| Report Component | What It Uncovers | Why It Matters for Strategy |
|---|---|---|
| Economic Forecasts | High-level indicators like GDP growth, inflation rates, and government spending. | Sets the overall economic tone and helps predict broad market stability or volatility. |
| Sector-Specific Analysis | Deep dives into key industries, highlighting which sectors are expanding and which are facing headwinds. | Allows you to pinpoint growth areas or identify potential risks within your specific industry. |
| Consumer Behaviour Trends | How and why consumer spending habits are changing. | Offers vital clues for product development, marketing campaigns, and sales strategies. |
| Risk Assessment | Potential geopolitical, economic, or regulatory risks that could impact the market. | Helps in proactive risk management and building more resilient business plans. |
| Compliance & Legal Landscape | An overview of the current regulatory environment and any upcoming changes. | Ensures your operations remain compliant and helps you prepare for future legal shifts. |
This table shows how each piece of the report contributes to a smarter, more forward-looking business strategy.
A well-structured BGC report doesn’t just present data; it connects the dots. It shows how a change in government policy might influence consumer spending in the services sector, giving businesses a direct line of sight into future opportunities.
This diagram shows how a report is typically put together, flowing from a high-level overview down to the more granular details.
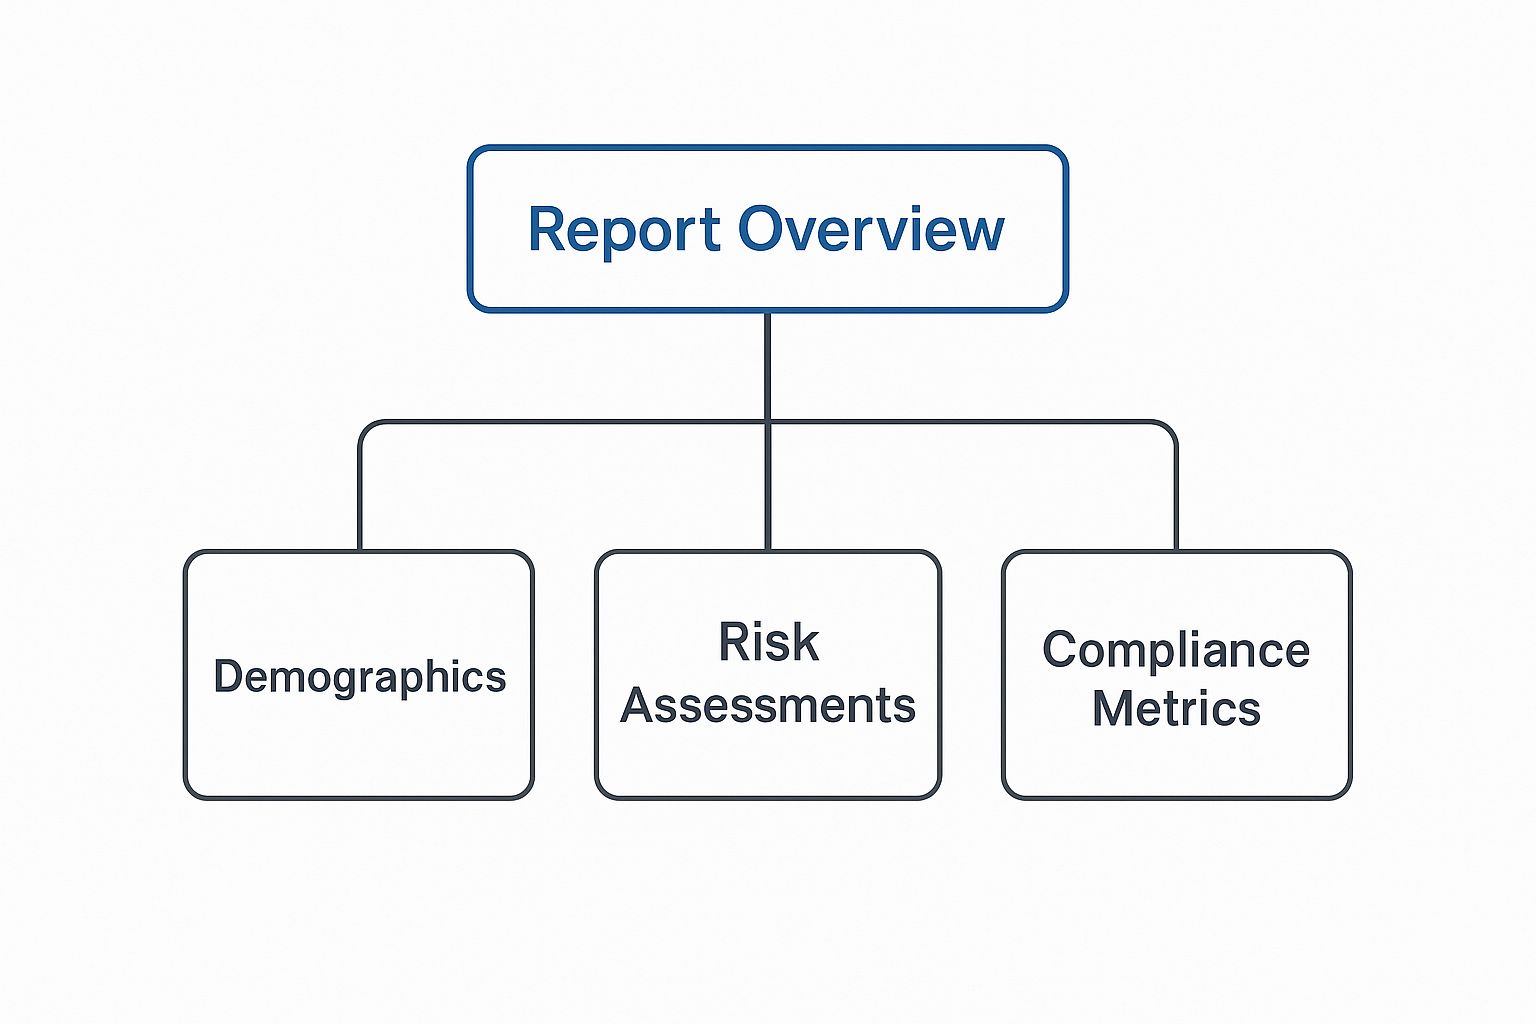
The visual flow makes it clear: a complete understanding of the market requires analysing demographics, potential risks, and compliance all together.
Reading the Economic Indicators That Matter

To make smart, strategic decisions, you need to be able to translate complex economic data into practical business intelligence. The insights a BGC report provides aren’t just for economists; they’re vital tools for understanding the forces shaping your market. Let’s break down the core metrics that tell the real story.
Think of Gross Domestic Product (GDP) growth as the overall speed of the country’s economic engine. A higher number signals more momentum, creating fertile ground for business expansion and consumer spending. It’s the most straightforward indicator of economic health.
On the flip side, a slowing GDP might suggest a more cautious approach is needed. This single metric gives you a high-level snapshot of the economic climate, helping you gauge market sentiment and potential demand for what you offer.
Decoding Key Growth Drivers
Going beyond the headline GDP figure is crucial to understanding what’s really fuelling the engine. A good BGC report will dissect the components of this growth, offering a much clearer picture of where the opportunities lie.
Two of the most important drivers to watch are:
- Private Consumption: This is the total spending by households on goods and services. It’s a direct reflection of consumer confidence and disposable income. When private consumption is strong, businesses in retail, e-commerce, and consumer goods tend to thrive.
- Government Spending: This often acts as a catalyst, injecting funds into major sectors like infrastructure, healthcare, or defence. A jump in government spending can create direct opportunities for businesses in those areas and have a positive ripple effect across the wider economy.
For example, India’s economy is in a robust growth phase. The Boston Consulting Group’s India Economic Monitor report cited a real GDP growth rate of 6.2% year-on-year, driven primarily by a surge in both private consumption and government spending.
By looking at both private and public spending, you move from knowing that the economy is growing to understanding why. This is the difference between simply observing the market and strategically positioning your business within it.
Capital Formation and Financial Health
Another essential piece of the puzzle is Gross Fixed Capital Formation (GFCF). This metric measures the net increase in physical assets within a country—think new machinery, buildings, and infrastructure. Essentially, it’s the economy’s investment in its future ability to produce.
A rising GFCF shows that businesses are confident enough to invest in expansion, which is a powerful signal of long-term optimism. Similarly, for any business with international dealings, understanding currency fluctuations is vital. Mastering the visual analysis of currency performance can be invaluable for anticipating market shifts, and resources for understanding the USD ZAR exchange rate graph can be very helpful here.
Finally, don’t forget the micro-indicators. The financial stability of your potential partners or clients is critical. A comprehensive credit check can reveal a lot about an entity’s financial health, perfectly complementing the broad economic data from a BGC report.
Identifying Winning Sectors and Industry Trends
Once you’ve got a handle on the big-picture economic indicators, it’s time to zoom in. The real power of a BGC report is its ability to slice and dice the economy into specific sectors, showing you exactly where the action is. This granular view is your ticket to spotting winning industries and making sure your business strategy is in sync with what’s actually happening on the ground.
Think of the national economy as a massive, complex machine. Sure, knowing the overall speed (GDP) is important, but what you really need to know is which specific gears are spinning the fastest. BGC reports do just that, breaking down the machine into its core parts—usually services, industry, and agriculture—and giving you the performance stats for each.
This kind of sectoral analysis helps you move past broad statements and find real, tangible opportunities. It answers the million-dollar question: “Where should I put my resources to get the best possible return?”
Interpreting Sectoral Growth Figures
The magic is in reading between the lines of the numbers. A BGC report might show the services sector is flying high with 7.4% growth, while the industrial sector is chugging along at a more modest 4.5%. What does that actually mean for your business?
- Services Sector Boom: A big jump here is a great sign for tech startups, financial services, and consulting firms. It means people have money to spend and are hungry for everything from new software to entertainment.
- Industrial Sector Growth: A steady climb in this area points to solid opportunities in manufacturing, construction, and logistics. It suggests that companies are building more things and investing in physical infrastructure.
For instance, that surge in services could be the green light a tech company needs to launch a new app, or for a marketing agency to go after a bigger client base. The data gives you a solid reason to invest, turning a gut feeling into a well-calculated move.
Understanding sectoral performance is like having a heat map of the economy. It shows you the “hot zones” where growth is concentrated, so you can aim your efforts where they’ll make the biggest splash.
Spotting Market Gaps and Emerging Trends
This level of detail is also brilliant for finding gaps in the market. If the fintech sub-sector is growing like crazy but nobody is building solutions for small businesses, you’ve just found a golden opportunity. The information such as BGC report provides acts as your treasure map to these less obvious openings.
By digging into the trends within each sector, you can start to predict what people will need next. A steady rise in digital payments and online lending, for example, tells you there’s a massive, ongoing shift in how people handle their money. Businesses that can tap into this trend are setting themselves up for long-term success. To get a better feel for this space, you can learn more about the evolving Fintech landscape in India and the opportunities it’s creating.
Ultimately, this kind of targeted analysis helps ensure your business isn’t just drifting along with the economic tide. Instead, you’re actively steering it towards the most promising waters, giving you a serious edge in a crowded market.
Understanding Modern Consumer Behaviour
After you’ve pinpointed high-growth sectors, the next logical move is to understand the people who actually drive that growth: the consumers. The single most critical element for any business is its customer, and insights from a BGC report give you a powerful lens into what people truly want and why they buy.
Think of consumer trends like strong ocean currents. You can try to swim against them and get nowhere, or you can learn to navigate them to reach your destination faster. These reports help you map those currents, revealing the subtle shifts in behaviour that can make or break a company. By studying this data, you can refine your marketing, anticipate future demand, and build products that genuinely connect.
The Rise of the Creator Economy
One of the biggest shifts we’re seeing today is the explosive growth of the creator economy. Modern consumers don’t just rely on traditional ads anymore; they turn to influencers and digital creators for recommendations, reviews, and inspiration. This has completely changed the path to purchase for millions of people across India.
And this isn’t just some niche trend; it’s a massive economic force. Findings from the Boston Consulting Group show that India’s digital ecosystem is home to between 2 to 2.5 million active creators. These creators directly influence over $350 billion in yearly consumer spending. It’s clear that creators are no longer just entertainers—they are a vital sales and marketing channel you can’t afford to ignore.
Understanding the creator economy isn’t just about marketing. It’s about recognising that trust has shifted from brands to individuals. Consumers are far more likely to buy something recommended by a creator they follow than something they see in a traditional ad.
The creator economy’s financial impact on Indian commerce is staggering. BGC reports highlight not just the current numbers but also the projected growth, showing a clear trend of creators becoming central to purchasing decisions.
The Creator Economy’s Impact on Commerce
| Metric | Current Status | Projected Growth |
|---|---|---|
| Creator-Influenced Spending | ₹2,800 Crore annually | Expected to reach ₹8,200 Crore by 2027 |
| Direct Creator Earnings | ₹1,600 Crore annually | Forecasted to hit ₹4,100 Crore by 2027 |
| Active Creators in India | 2 to 2.5 million | Projected to grow by 50% in the next 5 years |
These figures underscore a fundamental shift: creators are not just a marketing channel but a core part of the economic engine driving consumer behaviour in India.
Tapping Into Consumer Insights
So, how can you actually use these insights? Start by analysing which creators and platforms resonate most with your target audience. This information helps you build more authentic marketing campaigns that feel less like an advertisement and more like a genuine recommendation from a trusted source.
But these behavioural insights go well beyond influencer marketing. They can inform:
- Product Development: Understanding what consumers truly value helps you design products that solve real problems.
- Customer Service: Knowing how your audience communicates allows you to offer support on the channels they actually use.
- Brand Voice: Aligning your brand’s tone with your audience’s values helps build a stronger, more loyal community.
As creators become more and more integral to your brand’s identity, making sure their online presence is authentic and trustworthy is critical. A thorough social media verification can help safeguard your brand’s reputation when you partner with them. This process confirms that the digital persona you’re aligning with is credible, protecting your investment and maintaining consumer trust.
Putting BGC Report Insights into Action
Getting your hands on a BGC report is one thing, but understanding the data is only half the battle. The real magic happens when you turn those numbers and trends into a concrete, actionable business strategy. This is where knowledge transforms into a clear playbook for growth, helping you make decisions backed by solid evidence rather than just a gut feeling.
Think of the report as a detailed blueprint for a new building. The blueprint itself is useless until an architect and construction crew use it to lay foundations, raise walls, and install the wiring. In the same way, your job is to use the information from the BGC report to build a stronger, more resilient business.
This means shifting from just looking at the data to actually using it. It’s about using the insights to spot viable market entry points, get a realistic picture of the competitive landscape, and forecast future demand with much greater confidence.
From Data to Decisions
The first practical step is to map the report’s findings directly to your business goals. For example, if the report points to a 7.4% growth in the services sector and you’re running a tech startup, the immediate action is to figure out exactly how your product fits into that expanding market.
This process involves asking sharp questions that connect the data to real-world outcomes:
- Market Entry: Does the consumer spending data reveal an underserved demographic or a region that’s ripe for the picking?
- Competitive Analysis: What trends are my competitors sleeping on that I can jump on first?
- Demand Forecasting: How will the projected rise in private consumption affect our sales targets for the next two quarters?
A retail brand, for instance, could use consumer demographic data to pick new store locations. If a report shows a growing population of young professionals with high disposable income in a specific city, that’s a data-driven green light for expansion. This simple step can dramatically reduce the risk of opening a new store in the wrong place.
A BGC report doesn’t just tell you what happened in the past; it gives you the context to decide what to do next. It becomes a strategic compass, pointing your business towards genuine opportunities and steering you clear of potential pitfalls.
Building a Strategic Framework
Once you’ve identified these opportunities, the next stage is to build a framework around them. This isn’t about tearing up your entire business plan. It’s about making smart, strategic adjustments based on the fresh intelligence you now have.
You can build your action plan around these three core pillars:
- Risk Mitigation: Dive into the risk assessment section of the report. If it flags potential threats like regulatory changes or supply chain disruptions, your action plan might involve diversifying your suppliers or getting compliance updates ready ahead of time.
- Opportunity Capture: Pinpoint the top three growth trends from the report that align with what your business does best. For each trend, outline a specific initiative—like launching a new product feature or a targeted marketing campaign—to capitalise on it.
- Resource Allocation: Let the sector-specific data guide your budget. If the industrial sector shows sluggish growth but that’s your core business, you might allocate resources to improve efficiency. On the other hand, if a new sector is booming, you might decide to invest more in R&D to explore that market.
By systematically applying these steps, you create a dynamic strategy that’s directly plugged into market realities. This proactive approach ensures your business isn’t just surviving; it’s set up to thrive by making smarter, data-driven decisions that pave a clear path forward.
Your Next Steps for Strategic Growth

We’ve covered a lot of ground together, moving from high-level economic indicators all the way down to the specific consumer trends shaping business in India today. Hopefully, you now feel much more comfortable decoding a complex market analysis.
If there’s one thing to take away from all this, it’s that information such as BGC report data isn’t just a luxury for massive corporations. It’s a fundamental tool for any business that’s serious about building resilience and carving out a competitive advantage.
By getting comfortable with this data, you can finally shift from just reacting to market changes to actually anticipating them. That proactive mindset is what separates businesses that merely survive from those that truly thrive.
Translating Insights into Strategy
Of course, the real magic happens when you put this information to work. Turning raw data into a solid, forward-looking growth plan is where the rubber meets the road. It’s about building a framework for your company’s future that’s grounded in reality, not guesswork.
This often means integrating market insights from BGC reports into your wider business strategy. For instance, if expansion is part of your plan, these insights become critical for mastering franchise strategy development.
Think of your business strategy as a living document. It should be constantly challenged, refined, and validated by fresh market intelligence. Use what you learn from BGC reports to question your assumptions and uncover new avenues for growth you hadn’t considered before.
The market is always talking; the most successful businesses are simply the best listeners. Use these insights to navigate the road ahead with confidence, ready to sidestep the challenges and seize the opportunities waiting for you.
Still Have Questions?
It’s natural to have questions when you’re digging into something as detailed as business intelligence. Let’s tackle some of the most common ones that come up when using BGC report data to make sharper decisions.
What Exactly is a BGC Report?
Think of a Business Background Check (BGC) report not in the traditional hiring sense, but as a comprehensive health check for the market you operate in. It’s a deep-dive analysis that pulls together everything from economic forecasts and industry-specific trends to shifts in consumer behaviour. The goal is to give you a complete picture of the business landscape, helping you spot opportunities before they become obvious and manage risks before they become problems.
How Often Should We Be Looking at This Data?
Markets move fast, and basing your strategy on old information is a surefire way to fall behind. For most businesses, a quarterly review of this kind of market intelligence is a solid routine. This keeps you tuned in to emerging trends and gives you enough time to adjust your strategy before your competitors catch on. However, if you’re in a particularly fast-paced sector like tech or retail, you might even want to make it a monthly check-in.
The point isn’t just to read a report every now and then. It’s about creating a continuous feedback loop. Regular analysis makes sure your strategy is grounded in market reality, not wishful thinking.
Is This Kind of Information Only for Big Companies?
Not at all. While large corporations have been using this kind of data for ages, it’s arguably even more crucial for startups and small businesses. Why? Because smaller companies usually have less room for error. Making data-driven decisions isn’t a luxury; it’s a vital part of survival and growth. Insights from a BGC report can help level the playing field, allowing smaller players to find niche opportunities that bigger competitors might have missed.
How Can I Be Sure the Data is Accurate?
That’s a great question, and a critical one. Trusting the data is everything. Here are a few practical steps to make sure the information you’re using is solid:
- Check the Source: Is the report from a reputable provider known for high-quality research? Their reputation is on the line, so they have a vested interest in accuracy.
- Cross-Reference the Data: Don’t take any single report as gospel. Compare its key findings with other credible sources, like government statistics or respected financial news outlets.
- Look for Transparency: A good report won’t hide its methods. It should be clear about where the data comes from and what assumptions were made during the analysis.
Ultimately, the goal is to build confidence in your strategic direction, and that starts with trusting your data.
Ready to build a trustworthy team with confidence? SpringVerify provides fast, reliable, and seamless background verification to help you make informed hiring decisions. Learn more at https://in.springverify.com.


